Model & Strategy
Vela Institute conducted an in-depth analysis on student matriculation patterns by using data from NCES, NSC and IPEDS to examine higher education institution completion rates. This work followed up on the “To and Through Advising Initiative” of the National College Attainment Network and was supported by The Bill and Melinda Gates foundation.
To understand the completion rates of the institutions to which students matriculated, Vela aggregated numerous data files that included 71,771 student records from 116 high schools across 10 states. Vela explored completion rates of institutions where students matriculated by high school characteristics like income, percentage of students of color (specifically Black and Hispanic students), and locale (urban, suburban, or rural).
Scroll down to explore the data visualizations.
Our Impact
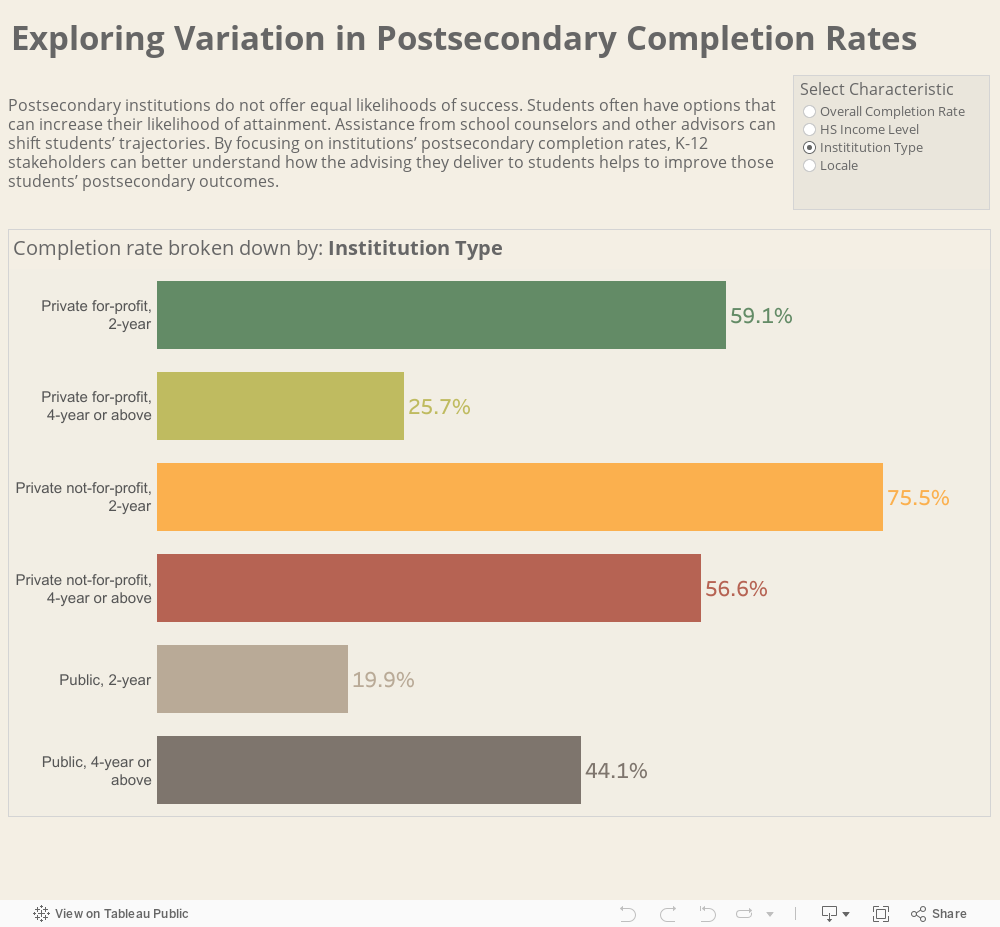
Vela analysis provided empirical evidence that where students attend is as important as whether they attend given that postsecondary institutions do not offer equal likelihood of success or completion.
Using geospatial analysis Vela also found students often had an alternative higher education institution within 50 miles of their high school that both had a higher postsecondary completion rate and that they could have attended based on academics.
Summary
The visualization below represents 71,771 student enrollment records from 116 high schools in 18 local education agencies across 10 states. Postsecondary completion rates were determined by matching the institution where a student first enrolled with that institution’s 150% of time (3 years for 2-year colleges; 6 years for 4-year colleges) completion rate. The figures below represent the average values for all students in the sample. The average postsecondary completion rate of all institutions where students first attended was 36.1%.
Poverty level: Percent of students eligible for free and reduced lunch at the high schools where students graduated. Source: NCES
Locale: High School code matched with NCES locale designations. Source: NCES
Institution Type: Reported institution type where students first enrolled. Source NSC
Summary
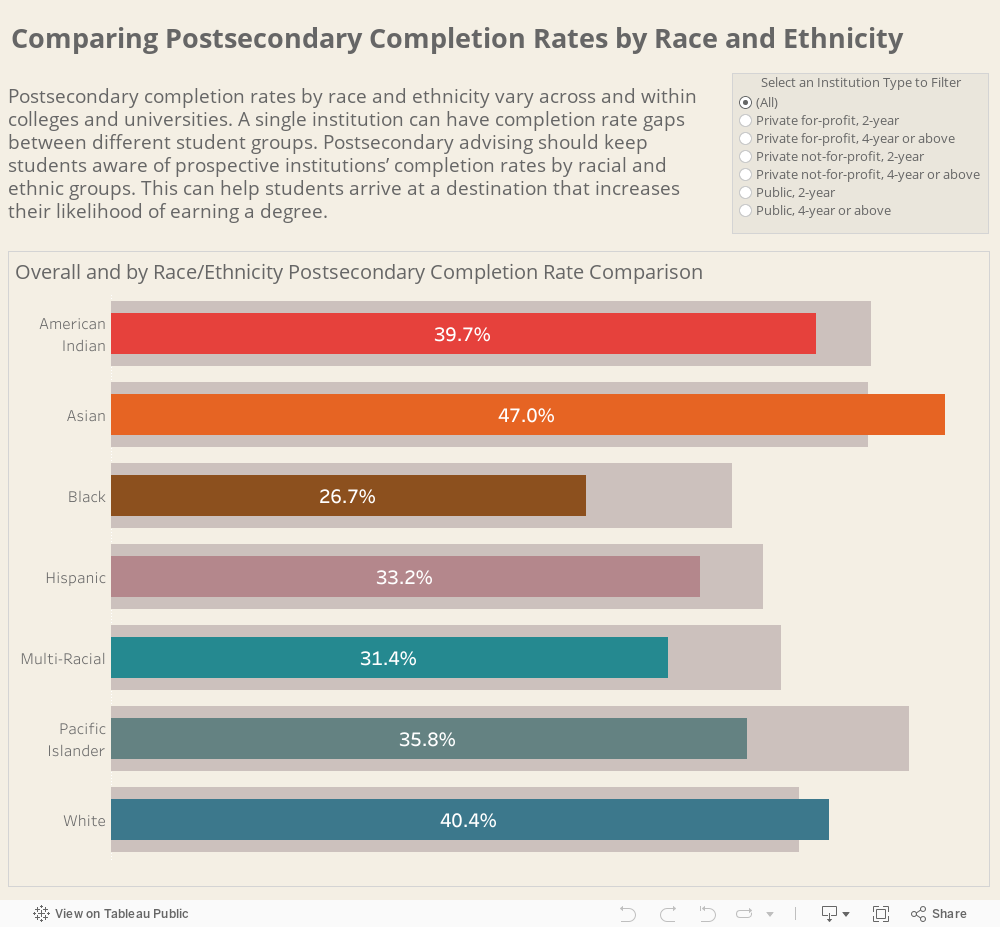
This visualization highlights postsecondary completion rate differences by race for 42,967 students. The addition of race and ethnicity data allowed for further exploration of how completion rates varied by race/ethnicity and institution type. The grey bar represents the overall 150% of time (3 years for 2-year colleges; 6 years for 4-year colleges) completion rate by first institution enrolled. The color bar is the completion rate by race/ethnicity at the same institution. Postsecondary completion rates by race were determined by matching (1) the institutions where a student first enrolled, (2) that student’s race /ethnicity, and (3) the institution’s 150% of time completion rate for students of that race/ethnicity.
Race: Race categories represent IPEDS race categories for institutional data